


Part I. Introduction and Objectives
The AI-driven literature review visualization project serves as a jumping off point for creating a living, iterative database of literature across the psychology of poverty. The addition of new and existing articles to our database will not only help to continue to synthesize evidence across different disciplines, but also help to identify gaps and underexplored areas for further research.
Figure 1 is the fundamental conceptual framework for this project. As there are multiple references to define poverty, the Poverty Context label helps to specify the contextual meaning, the Psychological Mechanism label identifies the effects of the related poverty context, and lastly, the Behaviors label demonstrates the main actions taken by the affected group. The ultimate goal for the project is to label them correctly and visualize critical metadata strategically.
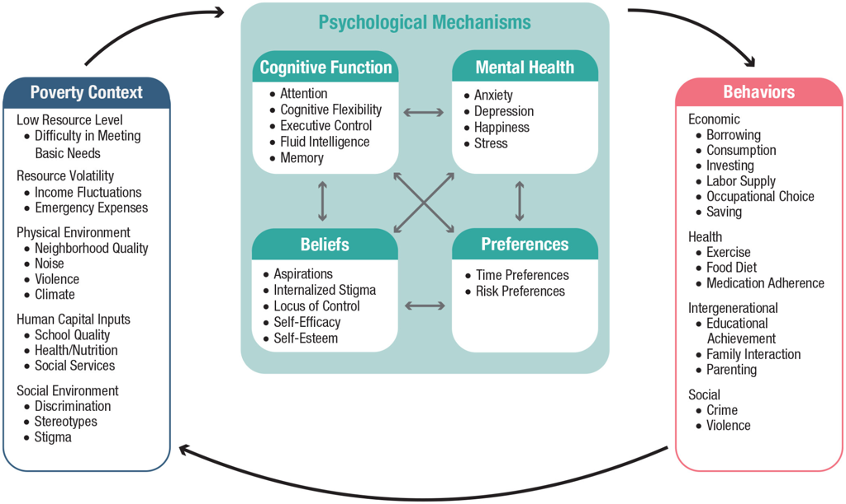
Source: Park et al. (2025), The Psychology of Poverty. Current Directions in Psychological Science. For details about each label, please see the Codebook.
Part II. API Data Collection
The dataset was created by collecting papers by various combinations of keywords. We employed OpenAlex API to retrieve relevant literature. The central main() function governs the end-to-end workflow, beginning with the concurrent extraction of papers for keyword-defined subcategories. This is achieved through multithreading with ThreadPoolExecutor, which enables the efficient retrieval at scale.
The extracted papers are then subjected to a few-shot classification model that labels them as "Related" or "Not Related" to the core themes of psychology of poverty. As such, we can ensure relevance and noise reduction for the dataset.
Once classified, the data undergoes a cleaning and normalization process. Duplicate entries are removed, and the resulting information is structured into normalized tables using the DOI as a unique identifier. These tables include detailed records for authors, citations, institutions, and publication metadata. The final output consists of both a comprehensive dataset and a subset of papers specifically identified as relevant.
Search keywords were carefully crafted around two thematic clusters. It includes economic aspects such as aspirations, risk preferences, and beliefs, as well as the psychological factors such as depression, anxiety, cognitive function, and attention. The dataset schema is designed to support the downstream analyses.
Part III. The Practical Application of AI
Data for the project is textual (abstract). We have a dataset with labelled data in two columns: the Poverty Context and Psychological Mechanism. However, we did not have the labelled Behavior column. Beyond what has appeared in the framework above, we also would like to gather labels for Research type and sample size as well (for the next phase after this Capstone).
| Advantage | Disadvantage | |
|---|---|---|
| LLM | No training needed (zero/few-shot); Strong generalization; Understands complex language/context; No need for feature engineering; Easily adaptable via prompts | High computational cost; Slower inference; Potential future costs |
| ML | Fast, lightweight, easy to deploy; Better interpretability; Works well on structured data | Needs large labeled datasets; Poor with nuance and context; Requires feature engineering/retraining |
We compared the strengths and weaknesses of ML and LLM. However, after the comprehensive discussion, the LLM-based approach seems to fit our task better. The decision is made based on the sample size of the labeled data (some desired categories are without labels, i.e., Behavior); on the rapidly changing ideas we always have. But even so, there are still challenges that we should pay special attention to even if we employ the LLM strategically (see Table 2).
| Challenge | Strategy | Limitation |
|---|---|---|
| Terminology | Interact with LLM to check understanding | API may not have a memory function, and interaction could rely on some memories |
| Small-sample size | Use LLM text generation to augment abstract sample with labels | But it inherently understands them much better than the real case |
| Multi-labeling | Set thresholds | Slow the labeling process and may affect the performance |
| Rate limits | Batching Processing | Potential formatting issues |
Apart from classification and labeling, there is much room for the practical application of LLM, including refining our existing codebook, understanding the underlying mechanism of reasoning as well as some domain-based knowledge. A summary has been provided as below (see Table 3).
| Types | Definition | Context-specific Application |
|---|---|---|
| Zero-shot Prompt | Straightforward instructions without additional context. | Soliciting immediate responses about poverty-related experiences without prior examples to refine the codebook. |
| One-, Few-, and Multi-shot Prompts | Offering one or more examples to guide the AI's response. | Presenting examples of poverty scenarios to improve the performance of classification. |
| Chain of Thought (CoT) Prompts | Encouraging the model to articulate reasoning steps leading to an answer. | Understanding the mechanism of LLM labeling. |
| Zero-shot CoT Prompts | Combining direct prompts with reasoning steps without prior examples. | Prompting AI to infer and explain the rationale behind behaviors observed in poverty contexts, so as to gain better understanding of the interconnectivity. |
Source: https://cloud.google.com/discover/what-is-prompt-engineering
Part IV. Pipeline for the Project
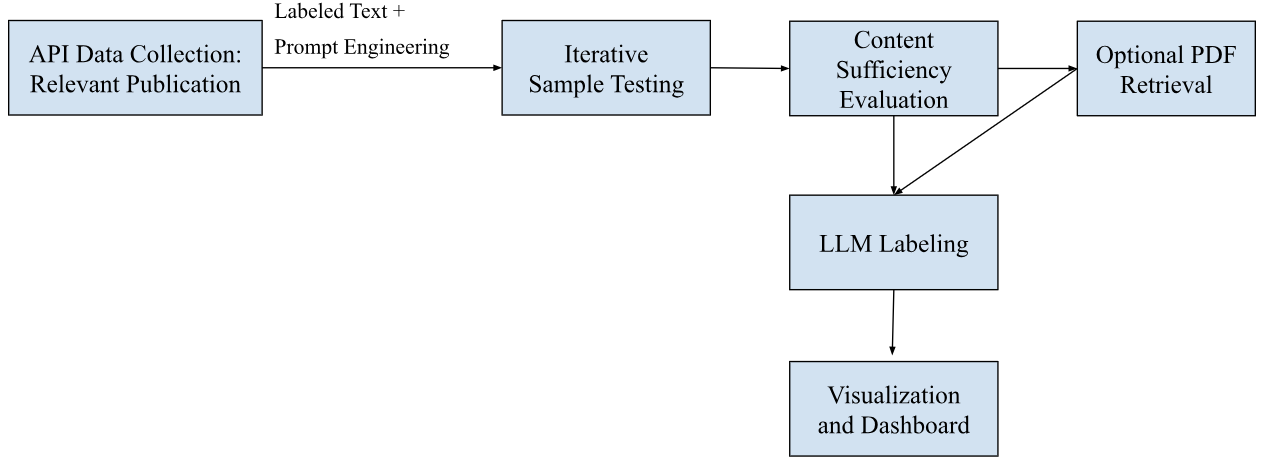
Figure 2 illustrates the overall workflow designed for labeling psychology of poverty literature using LLMs. The process begins with API-based data collection of relevant publications, followed by iterative prompt engineering and sample testing to improve the overall performance. A content sufficiency evaluation step determines whether the abstract alone is adequate for labeling or if full-text retrieval (via PDF) is required. Once content sufficiency is confirmed, LLMs are employed to classify the documents. The labeled outputs are then integrated into a visualization and dashboard system to support analysis and interpretation.
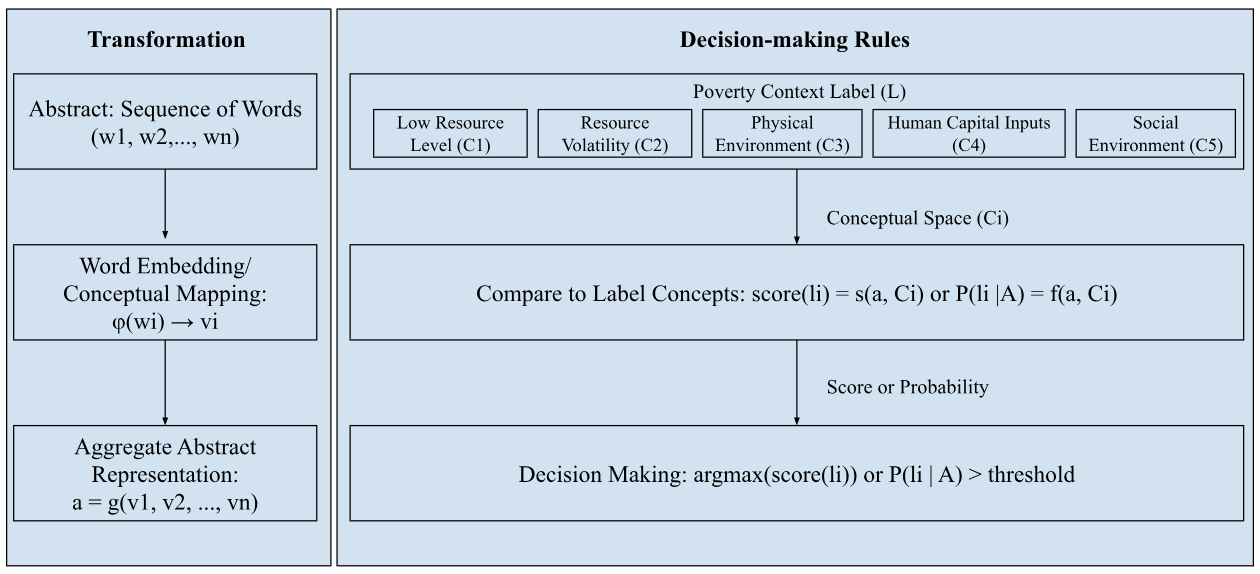
Source: Diagram is based on responses collected from interactions with the LLM.
The LLM labeling process begins with a transformation pipeline, where an abstract composed of a sequence of words is first mapped into a vector space through word embeddings. Each word is converted into a corresponding vector vi that captures its semantic meaning. These vectors are then aggregated into a single abstract representation a, typically via averaging or another function, which encapsulates the semantic content of the full abstract.
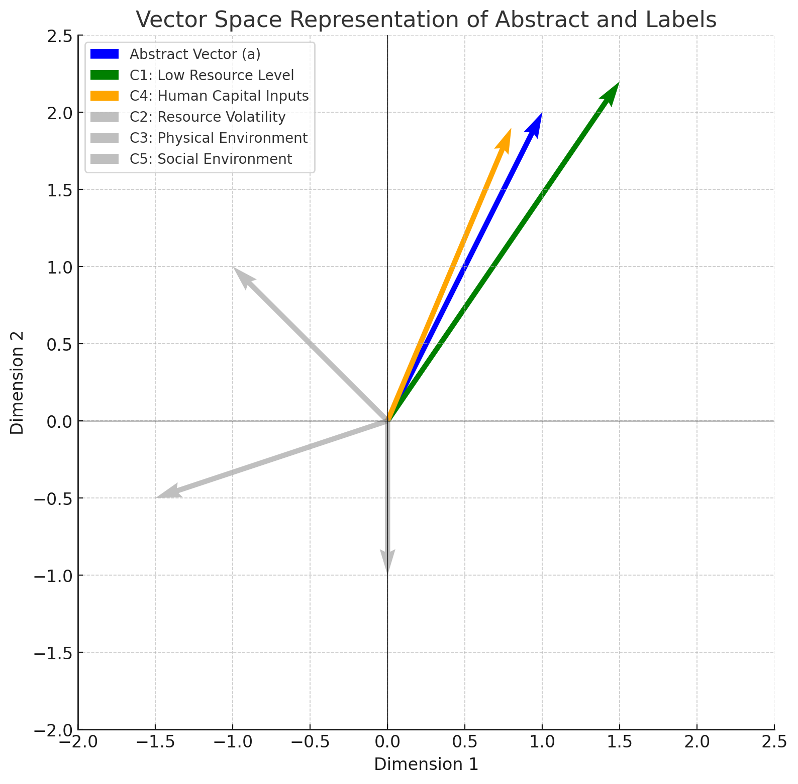
In the decision-making stage, this abstract vector is compared to predefined conceptual label vectors Ci. Ci represents different poverty contexts (e.g., Low Resource Level, Human Capital Inputs). Using a similarity function or probabilistic estimation, the model evaluates how closely the abstract aligns with each label. The final decision assigns one or more labels based on which has the highest score or probability, or exceeds a decision threshold. This process allows LLMs to perform zero-shot classification by mapping semantics into a shared conceptual space.
Part V. Analysis and Evaluation
1. Checking LLM's Understanding
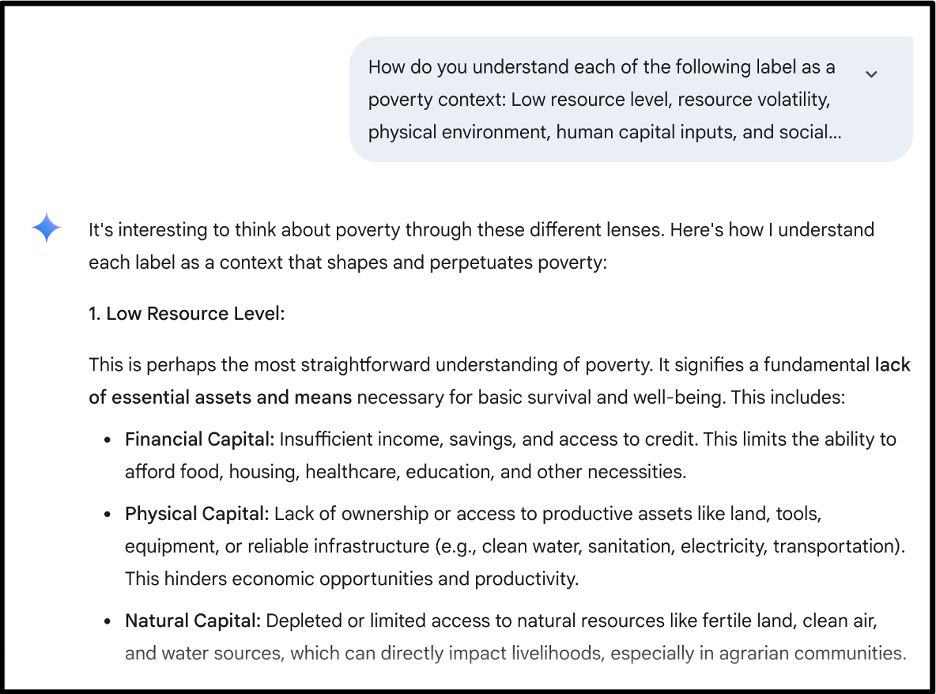
It is crucial to check the LLM knowledge base before we proceed to the more formal task. By collecting Gemini AI's thoughts, we can check if its understanding aligns well with the ones that appear in the codebook. In an informal way, we could directly interact with the model in the interface. However, we could also compare the similarity in a quantified way.
We write a function to compare LLM's inherent understanding of a concept to a user-defined one by prompting the model twice: once with the concept label alone (zero-shot) and the other time with the label plus a provided definition. After this, it measures the semantic similarity between the two responses using a sentence embedding model and cosine similarity. This allows the users to assess how closely the AI's natural interpretation aligns with their intended meaning.
Interventions may be necessary when the similarity score is low, and those interventions could be achieved by adding more context-specific information or generalizing the definition in the codebook a bit.
| Label | Definition based on the Codebook | Similarity Score |
|---|---|---|
| Low Resource Level | Difficulty in meeting basic needs | 0.8565 |
| Resource Volatility | Poverty caused by uncertainty such as income fluctuation or emergency expenses | 0.7389 |
| (Poor) Physical Environment | Poor Physical Environment such as bad neighborhood quality, noise, violence, and extreme climate | 0.8704 |
| (Poor) Social Environment | Poor Social Environment refers to the involvement of discrimination, stereotypes, and stigma | 0.7678 |
| (Low) Human Capital Inputs | Low Human Capital Inputs refers to poor school quality, health/nutrition, and social services | 0.8914 |
We modified the label name with a "sign" to facilitate more accurate understanding. In examples above, the LLM could understand the concept well, even if no extra information is provided. The above example for the Poverty Context label.
2. Content Sufficiency Evaluation
We assumed that well-written abstracts are supposed to include most key labels of interests (i.e., context, mechanism, behaviors, and study type). However, sometimes there might be restrictions on format that some key information is only available on the main body parts.
It is acknowledged that the inaccuracy of labeling could derive from insufficient information. Therefore, evaluating if the abstract content is informative enough is prerequisite. At this stage, our team has collected a large volume of relevant publications (about 10,000). Given that the dataset is large and processing it could be computationally costly, we decided to draw a random sample and use LLM as a binary representation. And due to the limited computing resources, we only draw 20 samples each time for demo purposes. However, the performance of the model is relatively stable.
| Poverty Context | Psychological Mechanism | Behaviors | Study Type | Avg. |
|---|---|---|---|---|
| 61% | 10% | 22% | 48% |
3. Prompt Engineering and LLM Model Performance Evaluation
The key components of an effective prompt, as recommended by Google (2024), include persona, task, context, and format. While we would like to make the instruction brief, we should also make the prompt as specific as possible. In the prompting guide 101, it is suggested that we turn Gemini AI into the prompt editor by asking: "Make this a power prompt: [original prompt text here]". As there's endless kinds of prompts for even a single task, we plan to iteratively refine prompts based on feedback to improve AI performance.
| Prompt Engineering Strategies | Overall Accuracy (%) | Issues Diagnose |
|---|---|---|
| Zero-shot prompt | 55% | The label output did not restrict to what is expected. i.e., Social and Social Environment |
| Basic Prompt: task+context+format | 70% | Relatively well |
| Detailed Prompt: persona+context+task+format | 80% | Relatively well |
| Structured Prompt: separate the chunk of information | 20% | The LLM might not understand the bullet points and the interrelationship |
4. The Two-tier Approach: from Abstract to PDF
As we have noticed, some abstracts contain only little information about certain labels. However, they are also the key information for visualization, so we design a pipeline to enable the model to read in the PDF file if any information is missing (labelled as insufficient information).
5. (Optional) Read in the Entire PDF
We did develop a pipeline to achieve information retrieval and labeling based on the entire PDFs. Given that this is not the emphasis at this cutoff point, it may not be fully adapted to the structure of our dataset (but still functional).
Part VI. Beyond the Method: How Visualization Meets our Missions
We have discussed various visualization strategies. Based on the data we have, there are a variety of combinations (i.e., labels+publication time).
| Chart Types | Potential Application | Practical Use Case |
|---|---|---|
| Bar Charts | Distribution | Understand strength of institutions and seek collaboration |
| Heat Map | Trend | The topic evolution |
| Sankey Diagram | Flow between categories (e.g., from context to mechanism, and to outcome) | Visualize how poverty contexts connect to psychological mechanisms and study outcomes |
| (Alternative) UpsetPlot | Intersection analysis across keyword categories | In addition to show the relationship, it also enables the presentation of distribution |
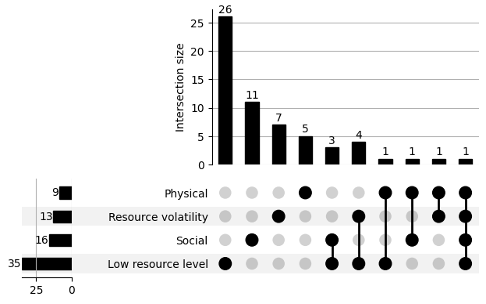
The above UpSet plot presents information about a single label, the Poverty Context. In addition to demonstrating the prevalence of a single topic, as shown on the left-hand side, the plot also has its merit to show the count of the sets. For instance, articles where "Social" and "Low resource level" co-occur three times.
However, as our use case is way much more complicated, we combine the two classification into one set. Due to the feature limitation of the UpSet plot, one way to differentiate the two labels is to add parentheses with extra information, such as "Context" (see Figure 6).
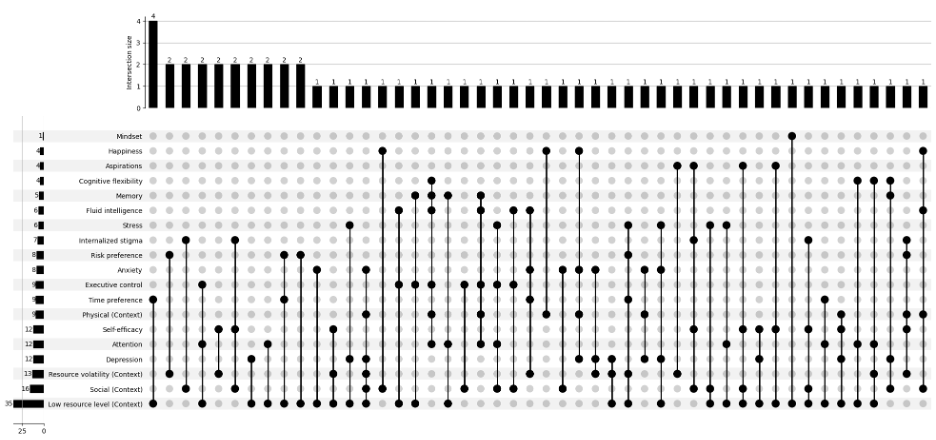
Link to the demo dashboard has been attached at the end. It will be adapted to real cases once the LLM-based labeling and information retrieval has been decided. Here is a tentative interpretation based on what we have for now:
Most leading institutions conducting research on the psychology of poverty are based in the United States. Among various poverty contexts, the social environment emerges as the most frequently studied category, appearing in approximately 34% of sampled publications. Across all poverty contexts, a wide range of psychological mechanisms are explored, with mental depression being the most prevalent, particularly in health-related studies, while preference-based mechanisms appear the least.
Historically, the connection between poverty and depression has been a central theme in literature since the 1940s. Over time, scholarly focus has shifted toward poverty narratives, followed by growing interest in children's experiences (childhood) and more recently in themes of sustainability.
Translated into the actionable insights: Early scholars who might want to learn the PEP field in depth, the United States would be a great home for research. New researchers should consider focusing on the social dimensions of poverty, as this remains the most studied context and offers numerous opportunities for engagement with existing scholarship. There is growing room for innovation in less-explored areas such as preference-based mechanisms. Scholars interested in emerging directions may find fertile ground in studying childhood poverty and sustainability themes, both of which reflect the field's shifting priorities and open avenues for interdisciplinary exploration.